🌍 ESG Dashboard – Environmental, Social & Governance Data Tracker
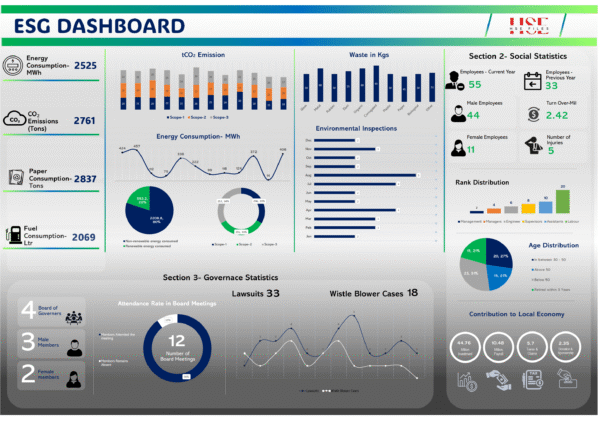
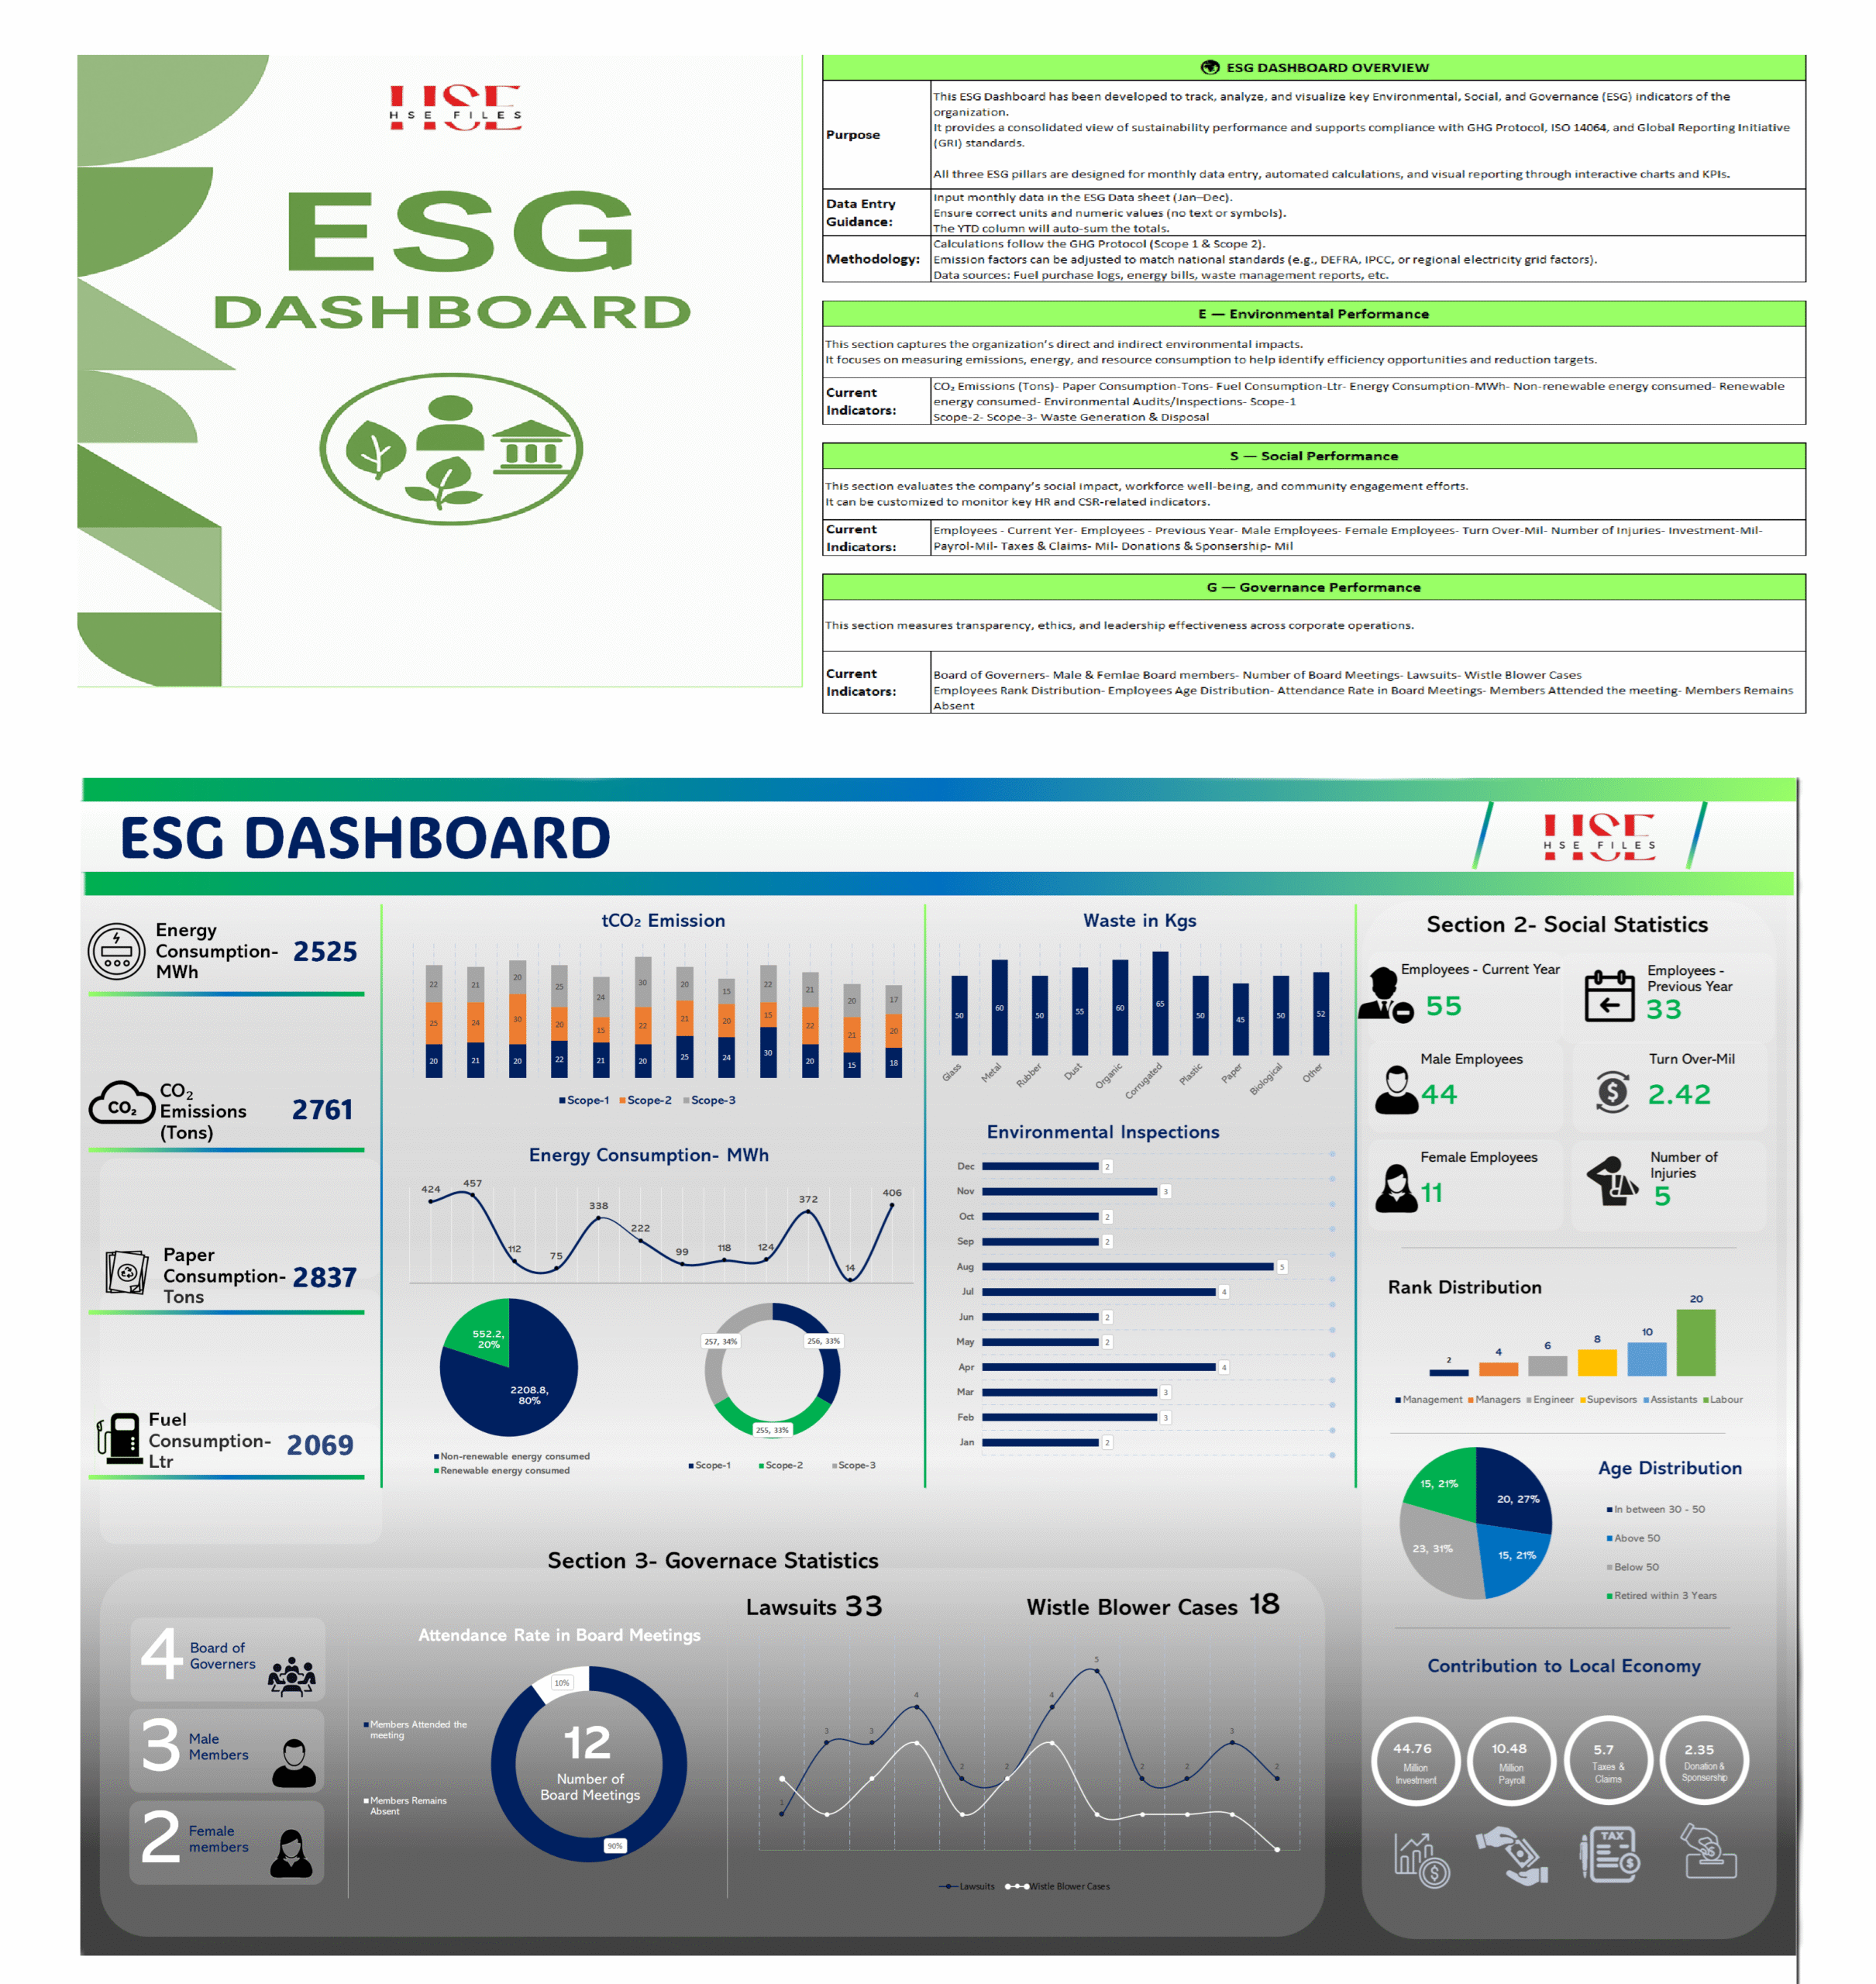
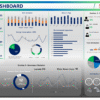
The ESG Dashboard is a comprehensive Excel-based analytics tool designed to measure, monitor, and visualize your organization’s Environmental, Social, and Governance (ESG) performance in one unified system.
It converts detailed monthly data into interactive visual dashboards and decision-ready summaries—empowering organizations to evaluate sustainability performance, support ESG reporting, and meet compliance obligations with ease.
🟢 Section 1: Environmental Statistics
This section quantifies the organization’s carbon footprint, resource use, and environmental initiatives, allowing performance tracking against sustainability goals and emission reduction targets.
Indicators Included:
CO₂ Emissions (Tons)
Paper Consumption (Tons)
Fuel Consumption (Liters)
Energy Consumption (MWh)
Non-Renewable Energy Consumed
Renewable Energy Consumed
Environmental Audits / Inspections
Scope 1, Scope 2 & Scope 3 Emissions
Waste Generation & Disposal (Glass, Metal, Rubber, Dust, Organic, Corrugated, Plastic, Paper, Biological, Other)
Outputs:
Monthly & YTD performance trends
Emission intensity and energy efficiency progress
Scope-based GHG summaries
Waste composition analysis for landfill diversion strategies
🔵 Section 2: Social Statistics
This section focuses on workforce, investment, and social responsibility, providing insights into employee well-being, organizational growth, and social contribution.
Indicators Included:
Employees (Current & Previous Year)
Male and Female Employee Distribution
Turnover (Million SAR)
Number of Injuries
Investment (Million SAR)
Payroll (Million SAR)
Taxes & Claims (Million SAR)
Donations & Sponsorship (Million SAR)
Outputs:
Gender ratio and workforce growth tracking
Monthly turnover and investment comparison
Payroll and tax contribution summaries
CSR and community engagement visualization
🟣 Section 3: Governance Statistics
This section evaluates corporate oversight, transparency, and ethical governance, promoting accountability and compliance with ESG and ISO frameworks.
Indicators Included:
Board of Governors
Male & Female Members
Number of Board Meetings
Lawsuits
Whistleblower Cases
Employee Rank Distribution (Management, Managers, Engineers, Supervisors, Assistants, Labour)
Age Distribution (30–50, Above 50, Below 30, Retiring within 3 Years)
Board Attendance & Absenteeism Rates
Outputs:
Governance effectiveness and participation score
Diversity representation in leadership
Board activity frequency and compliance trends
Risk and incident tracking for corporate transparency
⚙️ Dashboard Features
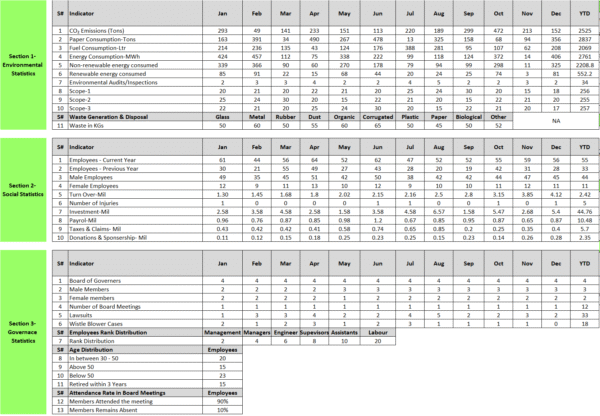
Pre-formatted data entry tables for each ESG pillar
Automated YTD totals and calculated summaries
Color-coded indicators for faster analysis
Compatible with charts and KPIs for dashboard integration
Editable layout for additional company-specific metrics
💡 Purpose
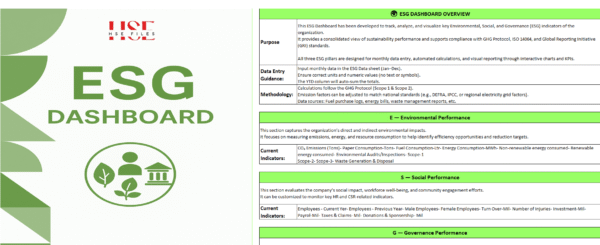
The ESG Dashboard provides organizations with a single, auditable platform to consolidate sustainability metrics, benchmark performance, and support transparent ESG reporting across all business functions.
🌱 Benefits
✅ Fully structured E–S–G framework
✅ Automated YTD & monthly calculations
✅ Ready for visualization in charts or Power BI
✅ Based on GRI Standards, GHG Protocol, and ISO 14064
✅ Supports ESG disclosure, sustainability strategy, and performance benchmarking
📘 Sheet Overview
| Sheet Name | Description |
|---|---|
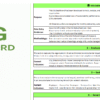
| Overview | Introduction, methodology, and usage instructions. |
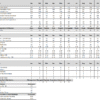
| ESG Data | Raw data entry for Environmental, Social, and Governance indicators. |
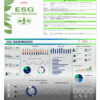
| Dashboard | Automated visualization and KPI tracking. |
| Cover Page | Branded presentation cover for reporting or submission. |
🏢 Who Can Use It
HSE & ESG Managers
Sustainability Consultants
Corporate Strategy Teams
Environmental Auditors & Analysts


Reviews
There are no reviews yet.