🚚 Fleet & Equipment Safety Dashboard – Vehicle Performance & Compliance Tracker
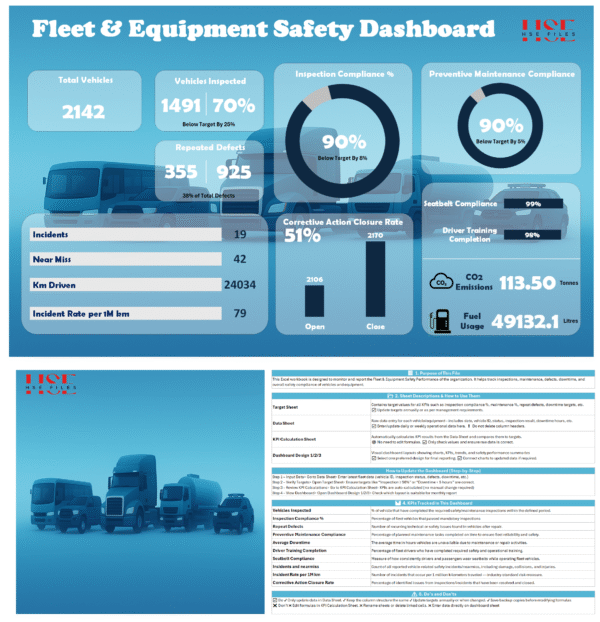
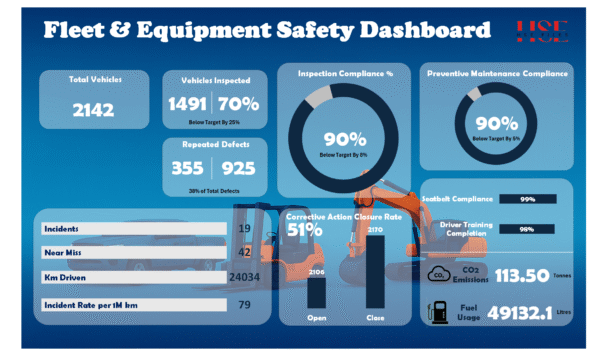
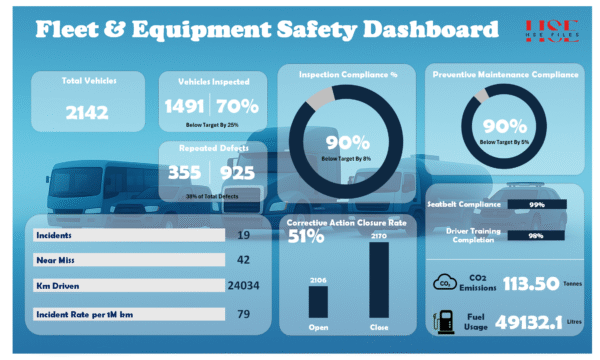
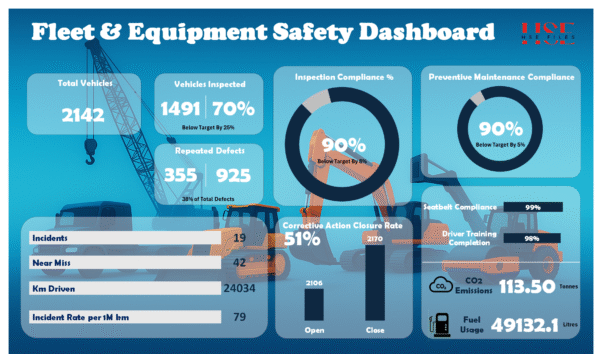
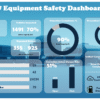
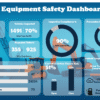
The Fleet & Equipment Safety Dashboard is a professional Excel-based analytics tool designed to track, monitor, and visualize your organization’s vehicle performance, maintenance status, safety compliance, and operational efficiency.
It converts raw fleet data into interactive dashboards, automated KPIs, and actionable insights — enabling organizations to reduce downtime, improve safety, and make data-driven decisions effortlessly.
🛠 Section 1: Fleet Performance & Maintenance
This section monitors overall fleet health, maintenance compliance, and equipment reliability to improve vehicle uptime and lifecycle management.
Indicators Included:
Total Fleet (Vehicles & Equipment)
Vehicles Inspected
Inspection Compliance %
Preventive Maintenance Compliance
Repeat Defects / Breakdowns
Average Downtime Hours
Fuel Consumption
CO₂ Emissions
Km Driven
Incident Rate per 1M Km
Outputs:
Vehicle health summary & maintenance alerts
Monthly & YTD maintenance compliance trends
Repeat defect ratio with root cause indicators
Downtime impact on operations & cost
Emission trends & fuel efficiency
🛡 Section 2: Driver Safety & Compliance
This section evaluates driver behavior, training, and safety compliance to reduce accidents and improve accountability.
Indicators Included:
Driver Training Completion %
Seatbelt Compliance %
Safety Incidents / Accidents
Near Miss Reports
Corrective Action Closure Rate
Outputs:
Driver readiness & qualification tracking
Real-time seatbelt usage trend
Accident, incident & near-miss analytics
Safety KPI vs Target dashboard
Corrective action status and closure efficiency
⚙ Section 3: Operational Metrics & Efficiency
This section provides operational insights to enhance productivity and performance of transport and logistics departments.
Indicators Included:
Km Driven (Monthly & Cumulative)
Fuel Usage & Cost
CO₂ Emissions (Fleet Carbon Footprint)
Fleet Availability vs. Repair Time
Cost of Maintenance & Repairs (Optional)
Outputs:
Fuel efficiency & CO₂ emission dashboard
Utilization analysis of vehicles and equipment
Comparison of active vs under-maintenance assets
Supporting data for ESG & sustainability reporting
📊 Dashboard Features
✔ Excel-based — No software or macros required
✔ Auto-calculated KPIs with color-coded performance (Red / Amber / Green)
✔ Customizable for Trucks, Vans, Forklifts, Cranes & Heavy Equipment
✔ Ready for integration with Power BI or presentation slides
✔ Professional design with multiple dashboard layouts included
💡 Purpose
To provide organizations with a centralized, data-driven system for monitoring vehicle maintenance, safety compliance, operational efficiency, and fleet sustainability — reducing risks and improving performance.
✅ Benefits
✔ Reduces manual reporting time
✔ Highlights high-risk vehicles & drivers
✔ Improves maintenance planning & cost savings
✔ Supports ESG, ISO 45001 & fleet audit requirements
✔ Enhances decision-making with real data insights
📁 Sheet Overview
| Sheet Name | Description |
|---|---|
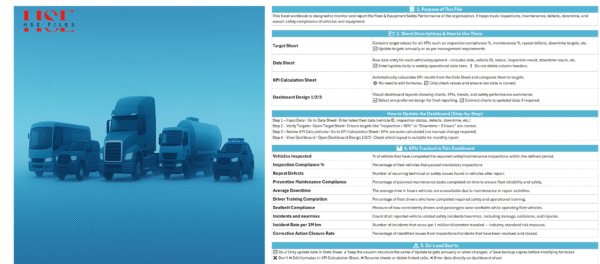
| Overview | Introduction, user guide & instruction manual |
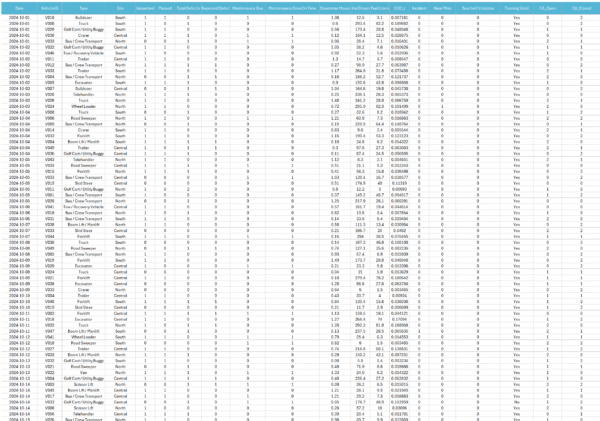
| Data Sheet | Raw entries: inspections, defects, fuel, km, incidents |
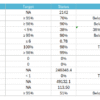
| Target Sheet | KPI targets for compliance and performance monitoring |
| KPI Calculation | Automated formulas for fleet performance results |
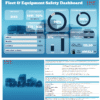
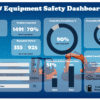
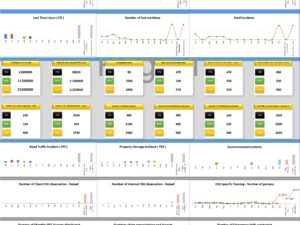
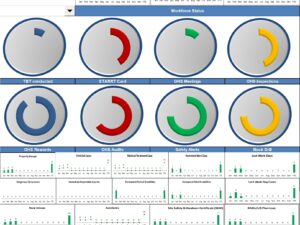
| Dashboard Design 1, 2 & 3 | Interactive dashboards for visualization & reporting |
👥 Who Can Use It?
Fleet Managers & Transport Supervisors
HSE & Safety Officers
Maintenance & Workshop Teams
Logistics & Operations Departments
Sustainability & ESG Reporting Teams






Reviews
There are no reviews yet.