The GHG Emissions Dashboard (Carbon Footprint Calculator) is an advanced, interactive Excel tool designed to help organizations calculate and visualize their Scope 1, Scope 2, and Scope 3 greenhouse gas (GHG) emissions in line with the GHG Protocol and ISO 14064 standards.
It transforms complex emission data into a clear, visual, and decision-ready format — allowing users to assess their carbon footprint, emission intensity, and top contributors at a glance.
With automated calculations, pre-loaded emission factors, and clean data visualization, it’s the perfect solution for ESG reporting, sustainability tracking, and corporate carbon management.
Sheet Overview:
Cover Sheet:
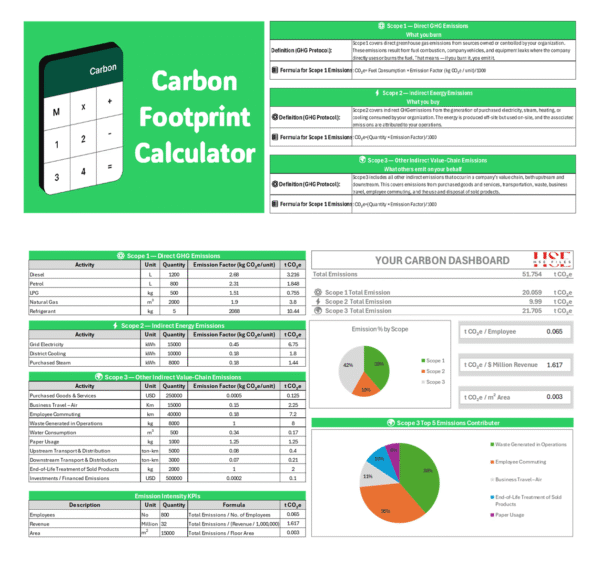
A professional and educational introduction to carbon accounting, explaining all three GHG scopes — Scope 1 (What you burn), Scope 2 (What you buy), and Scope 3 (What others emit on your behalf).
Each section includes official GHG Protocol definitions and formulas for transparent understanding of emission calculations.
Dashboard Sheet:
A powerful visual summary displaying total emissions across all scopes through dynamic charts and KPIs.
It showcases:
Total emissions (t CO₂e) and breakdown by scope
Emission % by Scope (pie chart)
Scope 3 Top 5 Contributors visualization
Emission Intensity KPIs:
t CO₂e / Employee
t CO₂e / $ Million Revenue
t CO₂e / m² Area
This sheet provides instant insights into emission sources, intensity ratios, and organizational carbon efficiency.
Calculation Sheet:
The functional core of the dashboard where all activity data is entered.
It covers a comprehensive range of emission categories:
Scope 1: Diesel, Petrol, LPG, Natural Gas, Refrigerants
Scope 2: Grid Electricity, District Cooling, Purchased Steam
Scope 3: Purchased Goods & Services, Business Travel, Employee Commuting, Waste, Water Use, Paper Use, Transport (Upstream & Downstream), End-of-Life Products, and Investments
Each activity is automatically multiplied by its respective emission factor (kg CO₂e/unit) and converted to t CO₂e, producing a fully transparent, formula-driven calculation table.
Purpose:
The purpose of the GHG Emissions Dashboard is to provide a single, reliable, and auditable platform for tracking and reporting an organization’s total carbon footprint.
It supports climate accountability and helps decision-makers identify emission hotspots, benchmark performance, and drive data-backed sustainability strategies.
Benefits:
Comprehensive Scope 1–2–3 Coverage:
Covers direct, indirect, and value-chain emissions for complete organizational transparency.
Automated Calculations:
Instantly converts input data into t CO₂e using pre-set emission factors, minimizing manual errors.
Visual Analytics & KPIs:
Interactive charts, intensity ratios, and top-emitter visuals simplify communication with management and stakeholders.
Protocol-Aligned & ESG Ready:
Compliant with GHG Protocol, ISO 14064, and aligned with ESG disclosure requirements.
Strategic Insight:
Helps track emission efficiency per employee, per revenue, and per area — key metrics for sustainability benchmarking.
Customizable & Editable:
Easily modify emission factors, units, and design to suit regional or company-specific requirements.
The GHG Emissions Dashboard is an essential Excel tool for Environmental Managers, ESG Analysts, Sustainability Consultants, and HSE Professionals.
It empowers organizations to measure, manage, and minimize their carbon footprint while advancing toward net-zero goals.


Reviews
There are no reviews yet.