⚖️ HSE Penalties Dashboard (Safety Violation & Non-Compliance Tracker)
The HSE Penalties Dashboard is a powerful, interactive Excel tool designed to help organizations track, calculate, and visualize safety and environmental violations across projects, departments, and contractors.
It provides full visibility into penalty data, violation frequency, and cost impact, transforming raw data into clear visual insights for effective HSE performance management.
With automated penalty calculations and dynamic charts, it’s the perfect tool for compliance reporting, contractor evaluation, and continual improvement tracking.
⚙️ Key Features
✅ Centralized Penalty Register
Easily record and monitor every HSE violation, including unsafe acts, PPE non-compliance, environmental offenses, or procedural breaches.
💰 Automated Penalty Calculations
Each record is automatically linked to the correct penalty value — ensuring transparent, consistent, and error-free reporting.
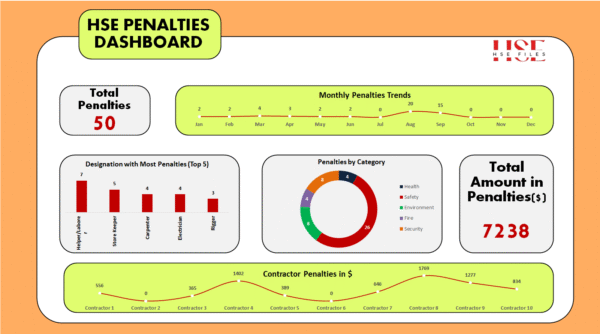
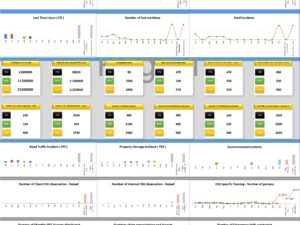
📊 Visual Dashboard Analytics
Gain instant insights from the built-in Dashboard, which displays:
Total Penalties by Month / Project / Contractor
Top 5 Violation Categories
Monthly Trend Charts
Penalty Cost Breakdown by Department or Type
% Contribution of Each Category (Pie Chart)
📈 Performance KPIs
Track your key safety and compliance indicators:
Total Violations Logged
Total Penalty Value
Average Penalty per Violation
Contractor / Department Performance
🧾 Sheet Overview
1. HSE Penalty Register
The data entry and tracking sheet — the operational core of the tool.
Users can record all violation-related data, including:
Date of Violation
Project / Department / Contractor
Violation Type and Description
Penalty Value (auto-calculated)
Responsible Party / Status (Closed or Pending)
This sheet maintains a transparent, auditable log of all HSE penalties and supports continuous monitoring of compliance trends.
2. Dashboard
An interactive visualization sheet that automatically summarizes data from the Penalty Register.
It features:
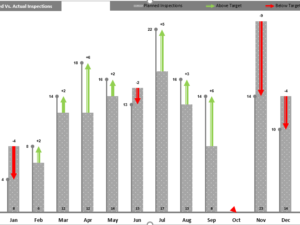
Monthly penalty trends and comparisons
Top 5 categories contributing to total penalties
Pie chart visualization by violation type or contractor
KPIs displaying total penalties, total violations, and average cost per incident
Ideal for management review meetings, monthly HSE reports, and client presentations, the dashboard provides a snapshot of safety performance and financial exposure at a glance.
3. Dropdown & Calculation
A back-end configuration sheet that powers the entire dashboard.
It contains:
Pre-defined penalty categories and rates for different violation types
Lookup tables for contractors, projects, and departments
Calculation formulas and validation lists to automate penalty computation and data consistency
Users can easily update penalty values or category lists here to match their internal HSE policy or client-specific requirements.
🎯 Purpose
The purpose of the HSE Penalties Dashboard is to provide a centralized, automated, and data-driven solution for monitoring safety compliance and financial penalties across multiple projects.
It helps organizations identify frequent violators, high-risk areas, and financial trends, enabling proactive management actions and stronger safety culture.
🌱 Benefits
📋 Organized Data: All penalties recorded in one structured, filterable register
⚡ Automated Calculations: Penalty values instantly calculated via formulas
📈 Visual Reports: Ready-to-present dashboard visuals with key metrics
💼 Accountability: Track responsible contractors or departments
📉 Trend Analysis: Understand recurring issues and prioritize improvement areas
🛠️ Customizable: Update penalty values, dropdowns, and visuals to match your policy
👥 Ideal For
HSE Managers & Coordinators
Compliance and Audit Teams
Project Managers & Safety Officers
Contractors and Subcontractor Management Teams
Corporate QHSE Departments
💡 Why Choose This Dashboard?
Because it transforms raw penalty logs into powerful compliance intelligence — helping you strengthen safety governance, improve reporting accuracy, and promote accountability across your projects.
It’s an essential part of your ISO 45001 and corporate HSE performance framework.
🔗 Related Products
Incident Reporting & Investigation Dashboard
Safety Observation Tracker
Training & Competency Matrix Dashboard
HSE Dashboard Package (45+ Excel Dashboards)
Environmental Aspects & Impacts Register


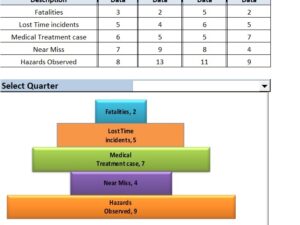
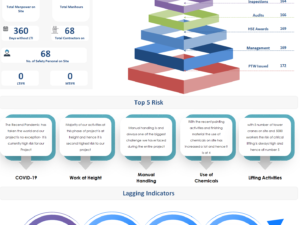
Reviews
There are no reviews yet.