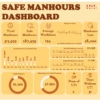
🦺 SAFE Manhours Dashboard – Total, Safe & Lost Manhours Performance Tracker
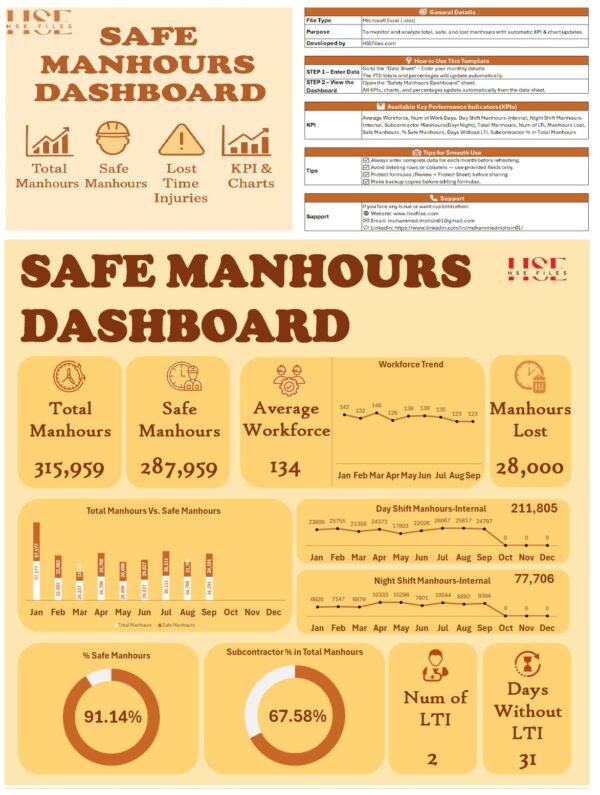
The SAFE Manhours Dashboard is a powerful Excel-based tool designed to help organizations record, analyze, and visualize their workforce and safety performance in one integrated system.
It automatically converts monthly data—such as manhours, workforce size, and Lost Time Injuries—into interactive charts and KPIs, making it easier for HSE teams to track performance, demonstrate compliance, and communicate safety achievements effectively.
🟠 Section 1: Manhours Statistics
This section consolidates all manhours data across day, night, and subcontractor activities, allowing users to assess total performance, identify trends, and highlight operational efficiency.
Indicators Included:
Average Workforce
Number of Work Days
Day Shift Manhours (Internal)
Night Shift Manhours (Internal)
Subcontractor Manhours (Day + Night)
Total Manhours
Outputs:
Monthly and YTD manhours totals
Comparison between day and night shifts
Subcontractor contribution analysis
Workforce trend visualization
🔴 Section 2: Safety Performance
This section monitors safety outcomes and automatically calculates safe manhours, lost time, and injury rates—providing instant insight into your site’s HSE performance and progress toward “Zero LTI” goals.
Indicators Included:
Number of Lost Time Injuries (LTI)
Manhours Lost
Safe Manhours
% Safe Manhours
Days Without LTI
Outputs:
% Safe Manhours by month and YTD
Days Without LTI counter and trends
Monthly comparison of lost vs. safe manhours
Dynamic LTIFR analysis (optional extension)
🟡 Section 3: Subcontractor & Workforce Ratio
This section helps track subcontractor engagement levels and their contribution to total manhours, ensuring transparent reporting between internal and external workforce participation.
Indicators Included:
Subcontractor Manhours (Day + Night)
Subcontractor % in Total Manhours
Outputs:
Real-time subcontractor percentage
Workforce mix ratio (Internal vs. Subcontractor)
Trend line showing changing subcontractor dependency
⚙️ Dashboard Features
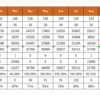
Pre-linked data sheet with automatic YTD calculations
Professionally designed visual dashboard with KPIs and trend charts
Auto-calculated Safe Manhours %, Days Without LTI, and Total Manhours
Color-coded indicators for quick performance assessment
Ready-to-print Export to PDF button for instant reports
Editable layout with space for logo and company information
💡 Purpose
The SAFE Manhours Dashboard allows organizations to monitor, manage, and present safety and workforce data efficiently.
It streamlines HSE reporting, enhances visibility of key indicators, and supports compliance with ISO 45001 and client reporting requirements.
✅ Benefits
Automated calculation of Safe, Lost & Total Manhours
Visual summary for quick management reviews
Monthly & YTD tracking for easy trend analysis
Separate Day, Night & Subcontractor breakdowns
Lightweight and fully editable Excel file
Printable dashboard for reports and audits
📘 Sheet Overview
| Sheet Name | Description |
|---|---|
| User Guide | Template overview, version info, and complete user instructions. Includes guidance on data entry, dashboard refresh, and export to PDF. |
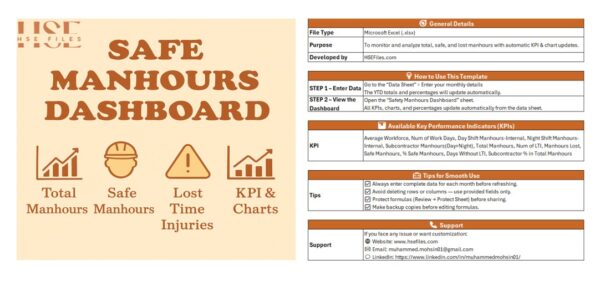
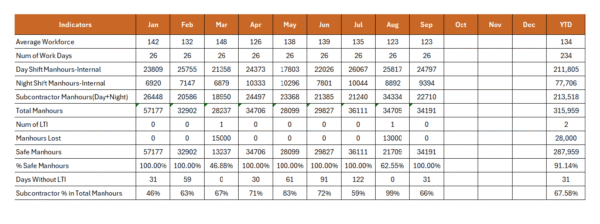
| Data Sheet | Central data entry table for recording monthly workforce, manhours, LTIs, and safe manhours. All key calculations (Safe %, YTD totals) are linked to the dashboard automatically. |
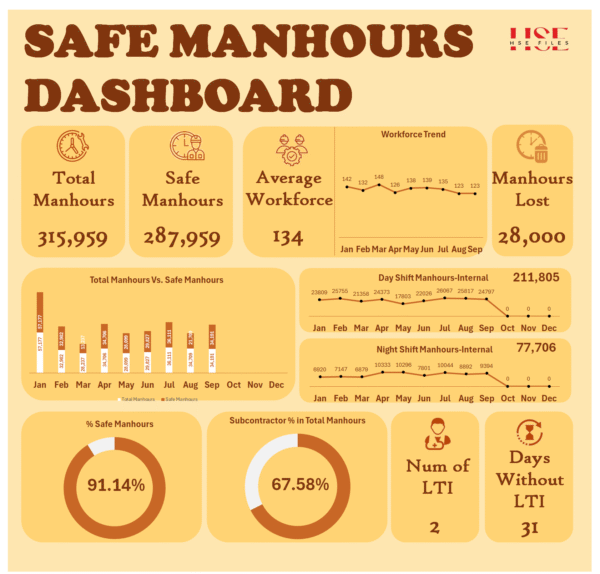
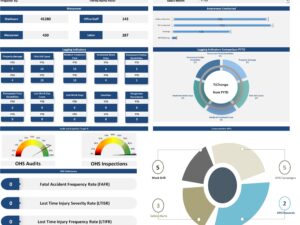
| Dashboard | Professionally designed KPI dashboard with charts and indicators for Total, Safe, and Lost Manhours, % Safe Manhours, Days Without LTI, and Subcontractor ratios. |
🏗️ Who Can Use It
HSE Managers & Safety Engineers
Contractors & Project Supervisors
Construction Companies
Facility & Maintenance Teams
Safety Consultants & Auditors
📊 Ideal For
Monthly and YTD HSE Reporting
Client and Management Presentations
KPI and LTI Performance Tracking
ISO 45001 Safety Performance Documentation




Reviews
There are no reviews yet.